Tuesday, September 8, 2009

Scheduled Reporting Services Reports against Analysis Services

I hit this issue a few years ago on a customer site. I always figured that it would be a good one to blog on, but it took a while to get around to creating my blog. Anyway here is what we came up with. Hopefully this will help someone out.

The issue is a simple one. Reporting services gives you the ability to schedule a report for off line delivery. A great feature but there is a snag. If your data resides in an Analysis Services Database, the only method of connecting to the database is via an AD user name. However an AD requires that either a user is logged onto the system or that a service is impersonating a user. If you try to create a subscription to a report that uses Analysis Services as a datasource, you will get a message box with the following message.

“Subscriptions cannot be created because the credentials used to run the report are not stored, or if a linked report, the link is no longer valid”

Now a user logging onto the system defeats the whole point of a scheduled report. How about impersonating a user? You sort of have some options here. While reporting services does not give you the option of saving credentials with your subscription, you can set the specific credentials a data source must use. So if you had a data source per user, you could set the current user credentials per data source, check the “Use as NT credentials” and you are away. The problem is all those data sources and yes, you guessed it, multiple copies of the same report, with each report set to an individual data source. This would be a nightmare to maintain with anything more than a few users. You could go do the route of a data source per Analysis Services role, but you still end up with the potential for a lot of duplicate reports for every unique role.

The solution we came up with is not idea, but overall, we thought it was better than the above. Let me know if you agree.

Reporting services loves expressions. Almost every object has an expression box, including the connection string field. In addition, inside in Reporting Services there is the User object. The function User!UserID will return the current network name of the logged in user. When you connect to an Analysis Services cube, you can use the “roles” connect string property to connect as a particular role and not user. Now the problem is that we have to associate that user ID with particular role. For the client this was a fairly straight forward task and they provided a SQL table that I could connect to that would associate a user ID with a role. With all of this in place, the steps are

1) Create a new data source and dataset on your report. This should connect to the SQL Database that contains the user id to roles map. The SQL for this should look something like; “SELECT role FROM AS_ROLES WHERE (UID = @GetUID)” I called this dataset “role”

2) Assuming you are working in RS 2008, you can switch to the Dataset Parameters tab and for the parameter value set it equal to User!UserID

3) Create a new report parameter (called UserRole in my case) and set its available values and default values from the dataset role. For now you might want to keep this as a visible parameters, but don’t forget to unset this prior to deployment to production.

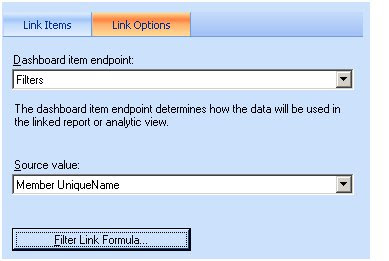
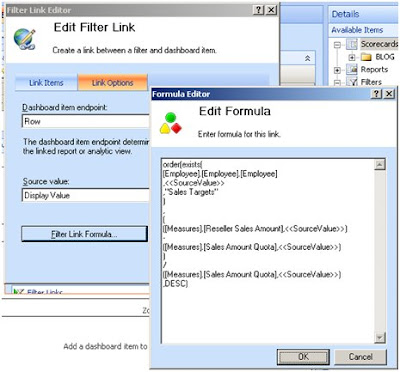
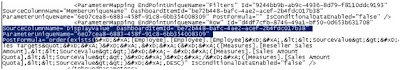
4) Now in your connection that connects to the cube, edit the connection string using the expression box and set it equal to ="Data Source=;Initial Catalog='Adventure Works DW';Roles=" & Parameters!UserRole.Value

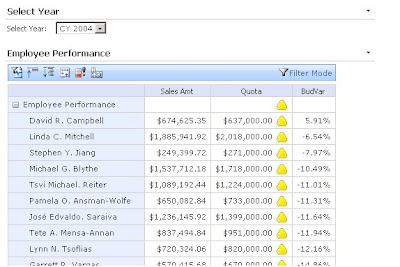
5) Compose the rest of the report as normal.

When you run the report, the following sequence of events kicks in
a) The data set described in 1 above will execute to return a single row that contains the role of the current user
b) The parameter UserRole get’s it value from a) above
c) The connection string described in 4 now connects using the parameter described in b
d) Your data set return data

Now you are not quite there yet. After deploying the report, you have to not edit the data sources of the report. For t he data source that connects to the Analysis Services cube, select the “Credentials stored securely in the report server” option and enter in a user name and password that has access to the cube. Now check the “Use as Windows Credentials when connecting to the data source.” option.

Finally now you should be able to run your report.

And when you click on “New Subscription” you now subscribe to this report. Notice the userRole field that is populated with the PPS role

Now this was a solution that we came up with some time ago. Since then I have discovered the EffectiveUserName connection option in Analysis Services. While I have not had a chance to test this method, using EffectiveUserName might be a lot simpler as it allows a person with sufficient privilege to connect as another user and not role. This would remove the need for a separate system to maintain the association between User ID’s and Role. I will look into this and report back.

Regards

Mark


Thursday, September 3, 2009

Apologies for the silence. Upcoming topics

Hi All,


So, I didn't manage to make a blog post last month, but then I was on vacation with the birth of my second kid. I am back at work now, so i hope to have a couple of posts this month. One on the issues of trying to schedule reporting services reports against an Analysis services cube and one on the choices you have when building a BI solution with MOSS 2007.


Talk soon


Mark


PS - Here is a picture of Cara.

Friday, July 24, 2009

Dynamic Rows, Ordering by Score and multiple use of a filter Member UniqueName

A recent requirement that I encountered on a customer site was their requirement that the rows that appeared on a Performance Point Scorecard were ordered by the traffic light status. All rows that have a big red status appear at the top of the scorecard, followed by the amber coloured members and followed by the green lights. Now this is very easy to do once the scorecard is displayed by clicking on filter mode and sorting by a column, but this approach has a couple of issues with it. 1) You have to do this every time as you can’t set the default sort order. 2) This approach assumes that you have a column that corresponds to your the score value.

In this blog I touch upon a few areas
1) How to create dynamic rows in a scorecard. When you design a score card, the rows are static. There is a technique that can be applied to make the rows dynamic
2) How to use a Filter Link “Member UniqueName” source value twice in a single scorecard, once for the purposes of filtering the KPI values and once for the dynamic creating of rows
3) How to extent the dynamic rows concepts to include ordering.

As have been blogged about elsewhere, the designed behaviour of dimension members on a performance point scorecard is that once you put a dimension member on a row, it becomes a static row member and new members are not added (or removed) based upon any filter you select. However as indicated here, there is a way to solve this. I used this technique to list members on my performance point rows; however a small extension to this same technique allowed me to order by the indicator status as well. I have used Adventure Works as a source for my new Dashboard. The basic Dashboard looks like;


I have my indicator set on the column Quote and I have selected Band by Stated score and supplied the MDX for the score. See the MDX sample below.

([Measures].[Reseller Sales Amount] - [Measures].[Sales Amount Quota])
/
[Measures].[Sales Amount Quota]

When creating the score card, I placed my KPI onto columns and then I drag the [Employees]. [Employees]. [Employees] attribute onto rows. This is just so I can render a scorecard. Next I create a Dashboard and on this dashboard I create a Filter based upon the Calendar Year. The next step is to drag both scorecard and filter on the dashboard page.


Now the fun starts to happen. You will notice that I have the select Year Filter on the Employee Performance scorecard twice. This is because I want to do two things with the filter. 1) I want to it to actual work as a filter for my KPI so that we can see an employees performance by a year. 2) I want to re-use that filter in a MDX statement that will determine what rows to display on the scorecard and how to order themThe first filter is straight forward. I connect the Top Row Filter to the Filters Dashboard Item End Point and use the Member UniqueName as the Source Value.


Now onto the second requirement which is to generate the rows of the scorecard based up the filter. I create a new filter link and this time I connect the Dashboard Item Endpoint to the DisplayValue. I then configure the Filter Link Formula as shown below. My MDX formula consists of an exists function wrapped inside an order function. The exists function gives me a set of employees that matches the selected year in the filter. The Order then sorts this list according to a value. The value that I am supplying is the same formula that I use to calculate the score. The sharp eyed observer will spot a problem here. I am using SourceValue when the Dashboard Item Endpoint refers to DisplayValue. Shouldn’t I refer to DisplayValue instead? I was hoping to be able to do this and everything appeared to work great, except the sort was not working. The Employees came out in the same order every time. The syntax to work with Display is strtomember('[Date].[Calendar Year].[DisplayValue]') however this did me no good. Instead, I need to use the SourceValue and corresponding Member UniqueName a second time. Unfortunately the PPS scorecard builder does not allow you to do this. To get around this you have to edit set .bsmx XML file. More on this later on.


My MDX used above.
order(exists(
[Employee].[Employee].[Employee]
,SourceValue
,"Sales Targets"
)
,
(
([Measures].[Reseller Sales Amount],SourceValue )
-
([Measures].[Sales Amount Quota],SourceValue )
)
/
([Measures].[Sales Amount Quota],SourceValue )
,DESC)


I put in the Filter Link Formula that refers to SourceValue and leave the Source Value entry on the Filter Link Editor as Display Value.
I now publish and have a look at my new scorecard.


The scorecard displays but you can see that the sort order is not working. (I have put the a BudVar column onto the scorecard to make it very obvious what the field used to generate the score is reading.)
At this stage I have to close my scorecard in the scorecard builder app. Then I browse to the windows folder that I have saved the .bswx file, take a copy and then edit the file in notepad. I found the fastest way to fine the correct section in this file was to search for order(exists( which are the first bit of MDX of my Filter Link Command.


The first bit of the highlighted section reads SourceColumnName=”DispalyValue”. Change this to SourceColumnName=”MemberUniqueName”. Save the file. Open the file again in Dashboard Designer and publish again. This time your scorecard should run as you want.


Finally! Now this solution is not ideal as you have to edit a .bsmx file which raises all sorts of questions about future maintenance of this edit. It is annoying that the system supports this functionality, but you can’t edit it directly. I would be advise caution to anyone who needs this. Is it really necessary in the solution? If it is, document the steps and put in place some procedure that future edits to the bsmx won’t forget about this edit.

Have a good day
Mark

Tuesday, June 23, 2009

Look forward to look back - Make your MDX problem part of the DB

A recent issue I encountered with a customer of mine was a performance issue with the MDX that had been created to handle a particular type of last year comparisons. For the sakes of simplicity, I will change the scenario slightly. There is a newsgroup post about this issue on http://social.msdn.microsoft.com/Forums/en-US/sqlanalysisservices/thread/ff4f2fcb-ae33-46e1-aca4-06504e23743e/?prof=required

The problem is to do when you are comparing sales of a group of shops to the sales of the same shops last year. Imagine you had a set of the shop that are coloured as follows
Shop Colour
A Green
B Green
C Green
D Red
E Red
F Blue

Now if you want to compare the sales of shops that are blue with the sales for last year, initial you might try something like; (I am doing a simple Last year Variance, i.e. This year less Last Year)

([Measures].[Sales],[Shops].[Colour].&[Blue])

-

(parallelperiod([Time].[Time].[Year],1,[Time].[Time].currentmember),[Measures].[Sales],[Shops].[Colour].&[Blue])

This compares my sales of blue shops to the sales of blue shops from last year. Right? Well in my customers case, wrong. It turns out that in their case, they want to compare sales of shops that are blue this year with the sales of those same shops last year.

So if my data set is

Shop Colour/Sales This Year Colour Last Year
A Green/1000 Green/1500
B Blue/2000 Blue/2100
C Green/1500 Green/1400
D Red/1250 Blue/1100
E Red/1500 Red/1750
F Blue/2100 Red/1500

Then my result is (2000 + 2100) - (2100 + 1500) = 500 ( (B+F)_ThisYear - (B+F)_LastYear)
and not (2000 + 2100) - (2100 + 1100) = 1,000 ( (B+F)_ThisYear - (B+D)_LastYear)

Now it turn out the new way of doing this is a bit more difficult than the original method. The MDX was correct but slow. For the current time member and colour, you would have to get the set of matching current stores. ({B,F} in my data set above.) Now for this set of shops, you have to perform a sum across this set of store. So you calculation looks something like

([Measures].[Sales],[Shops].[Colour].&[Blue])
-
sum(exists([Shops].[Shops].children, [Shops].[Colour].&[Blue]),
(parallelperiod([Time].[Time].[Year],1,[Time].[Time].currentmember),[Measures].[Sales]))

That sum and exists is a killer for performance and knocked the query into the slow Cell Evaluation mode and not the fast Block evaluation mode. All manner of rewrites of the MDX did little to change the performance of the query.

In the end, some of the solution had to be moved into the DB Layer. We created a table that had time and the shop as the composite key. With this key there was an attribute called "NextYearColour". This table was used to create a new dimension called ShopVersion with an Attributes call NextYearColour. The table was also used as measure group. This was important so we could join time to the table. Now our query looks like

([Measures].[Sales],[Shops].[Colour].&[Blue])
-
(parallelperiod([Time].[Time].Currentmember,[Time].[Year].[Year],[Measures].[Sales],[ShopVersion].[NextYearColour].&[Blue]))

Now that the sum and the exists are gone, we are back to fast performance again.

I guess the moral of the story here is to always consider putting something into the DB layer and making it real in the cube. MDX is great and you can almost always get MDX to get you the result, but the trade off may often be in performance.

I hope this blog post (my first as it happens!) proves to be useful to someone.

Mark